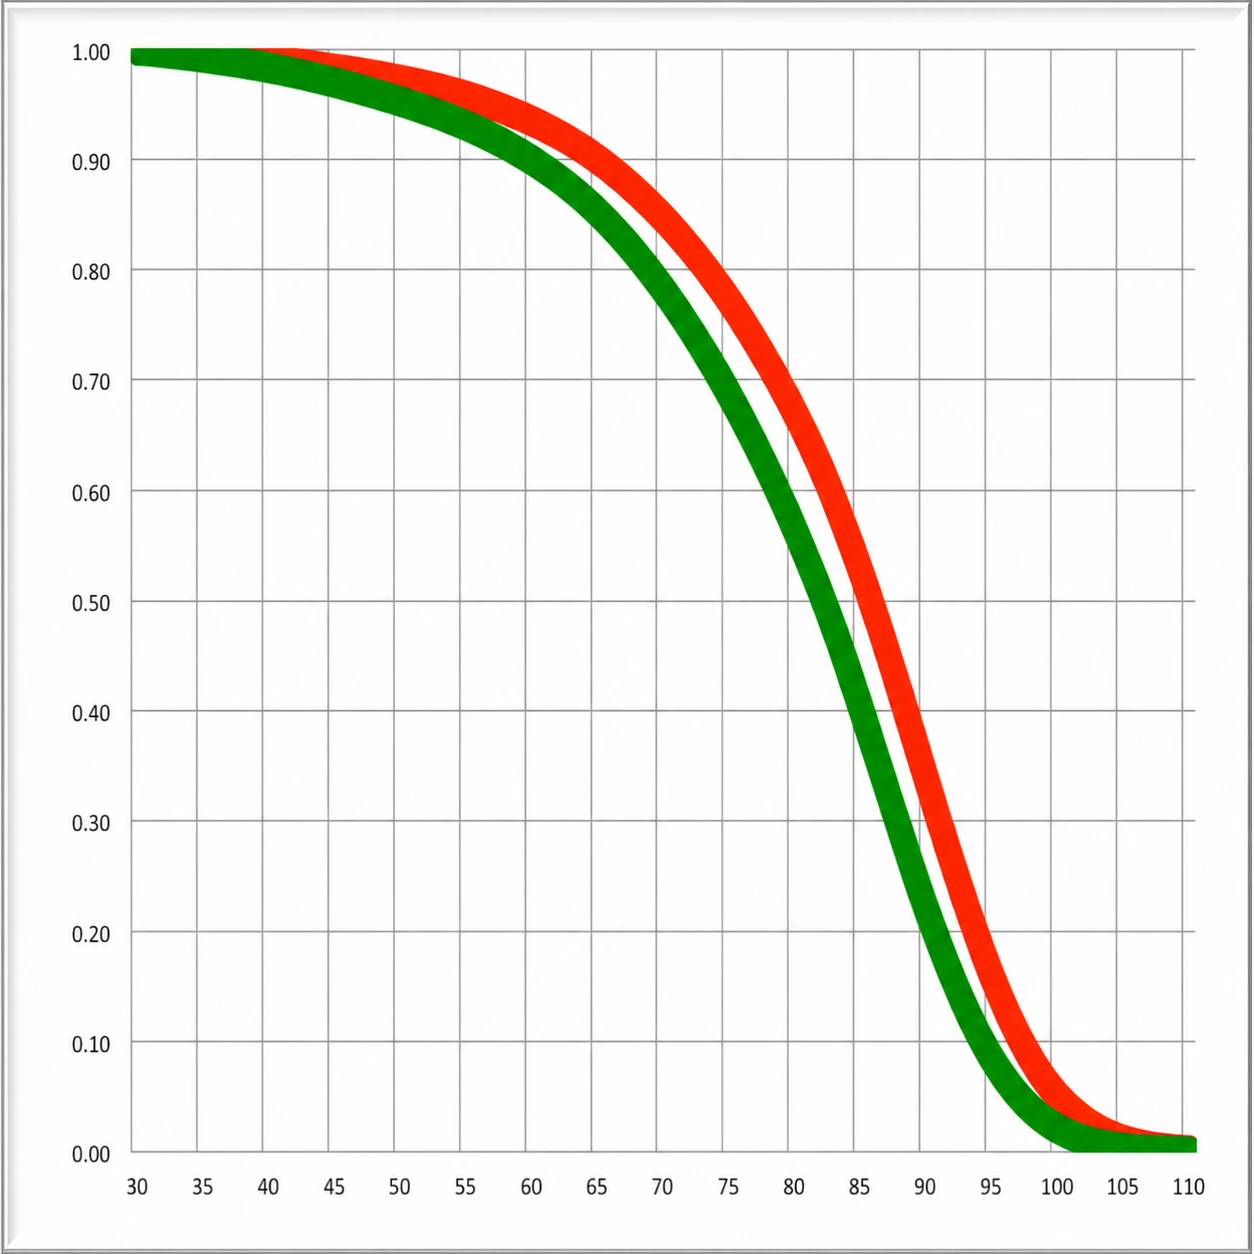
Below is a sample survival curve (probability of survival to future ages) for females (upper) and males (lower) at age 30.
The Population link displays a US population projection from 2025 to 2070 split between 65 and older and below 65.
The Life Expectancy link provides short movies illustrating how the probability of survival curve changes by attained age.